While I use debuggers quite a lot at work in IDEs such as VisualStudio, PyCharm or QtCreator (of course all configured to use vim-like keybindings), I seldom use them when working on my side projects.
This is maybe due to the fact, that for my side project I mainly use vim together with make/cmake, python or Rust and cargo. My "debugging" then revolves mostly around printing variables and getting stacktraces with gdb if something goes very wrong.
Also, when programming in Rust, I never felt the need for a debugger, since one hardly gets a segmentation fault.
Nevertheless I thought it would be a good idea to try to integrate gdb within vim to be able to debug code if necessary. After some sophisticated research with duckduckgo, I found quite some vim plugins for gdb support and this stackoverflow entry which compares some of them. The one that stood out for me was Conque-GDB because it looked very simple yet powerful.
Conque-GDB
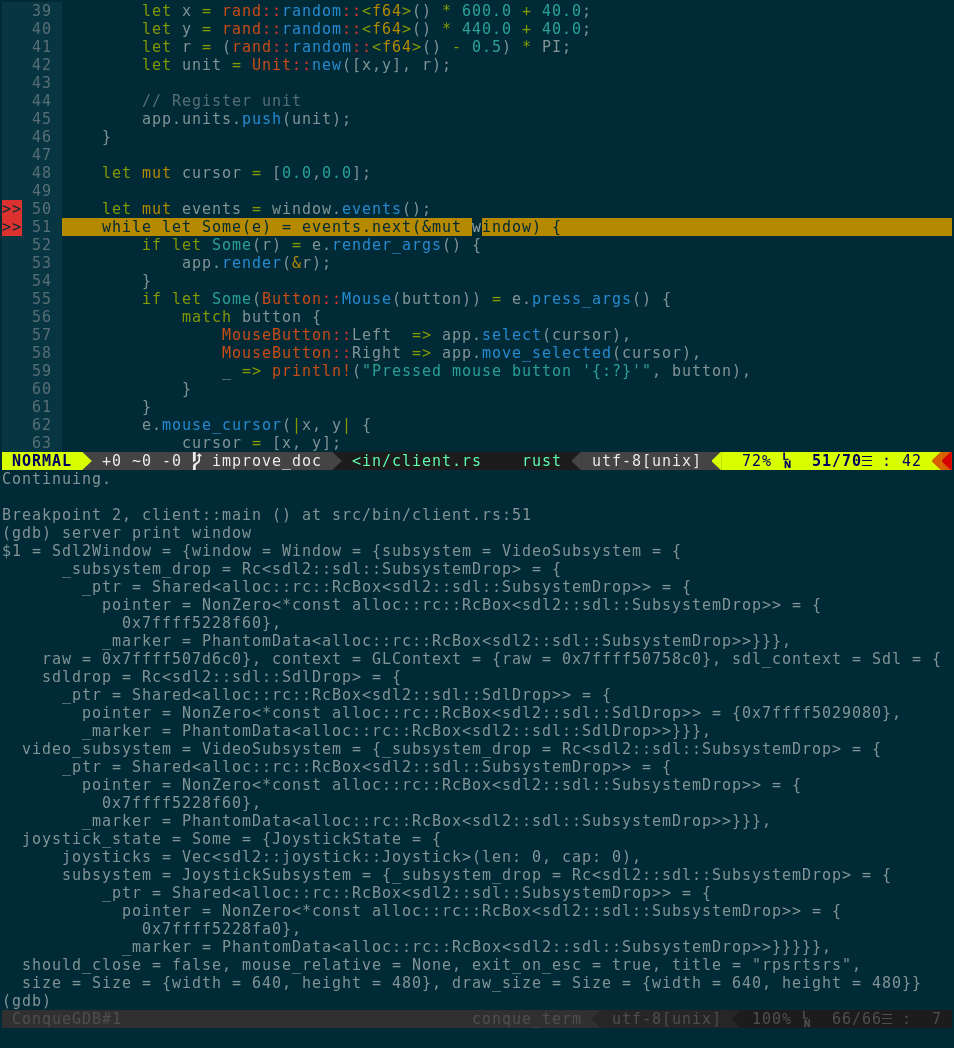
Conque-GDB is a very simple vim plugin which provides a vim buffer that acts as a terminal emulator and runs gdb in it.
Further it provides some keybindings to control the gdb instance like <Leader>r to run the process or <Leader>b to set a breakpoint at the current line and so on. There is a small demonstration video available on youtube which shows some of the capabilities of the plugin.
If you use vundle to manage your vim plugins installing Conque-GDB is as easy as adding
Plugin 'vim-scripts/Conque-GDB'
to your ~/.vimrc. I found it quite useful since it allows you to do the following things:
- Set breakpoints from within vim
- Show the current position of execution in vim
- Examine the contents of variables from within vim
- Some more stuff!
Using it with Rust
Conque-GDB allows to define your own gdb executable using the :ConqueGdbExe command. To debug Rust code one probably wants to use rust-gdb for pretty printing support of Rust bindings.
To debug Rust code we first set :ConqueGdbExe rust-gdb. Then we start an instance using :ConqueGdb target/debug/$name where $name is the name of the executable you want do debug. Then we may set some breakpoints using <Leader>b and finally run our program with <Leader>r. When hitting a breakpoint we can examine variables using <Leader>p to print their content.
For me this is quite a decent debugging experience while still being able to stay in my favourite text editor!
Do you have any comments, found a bug or an error? Please leave a note on Reddit.